About
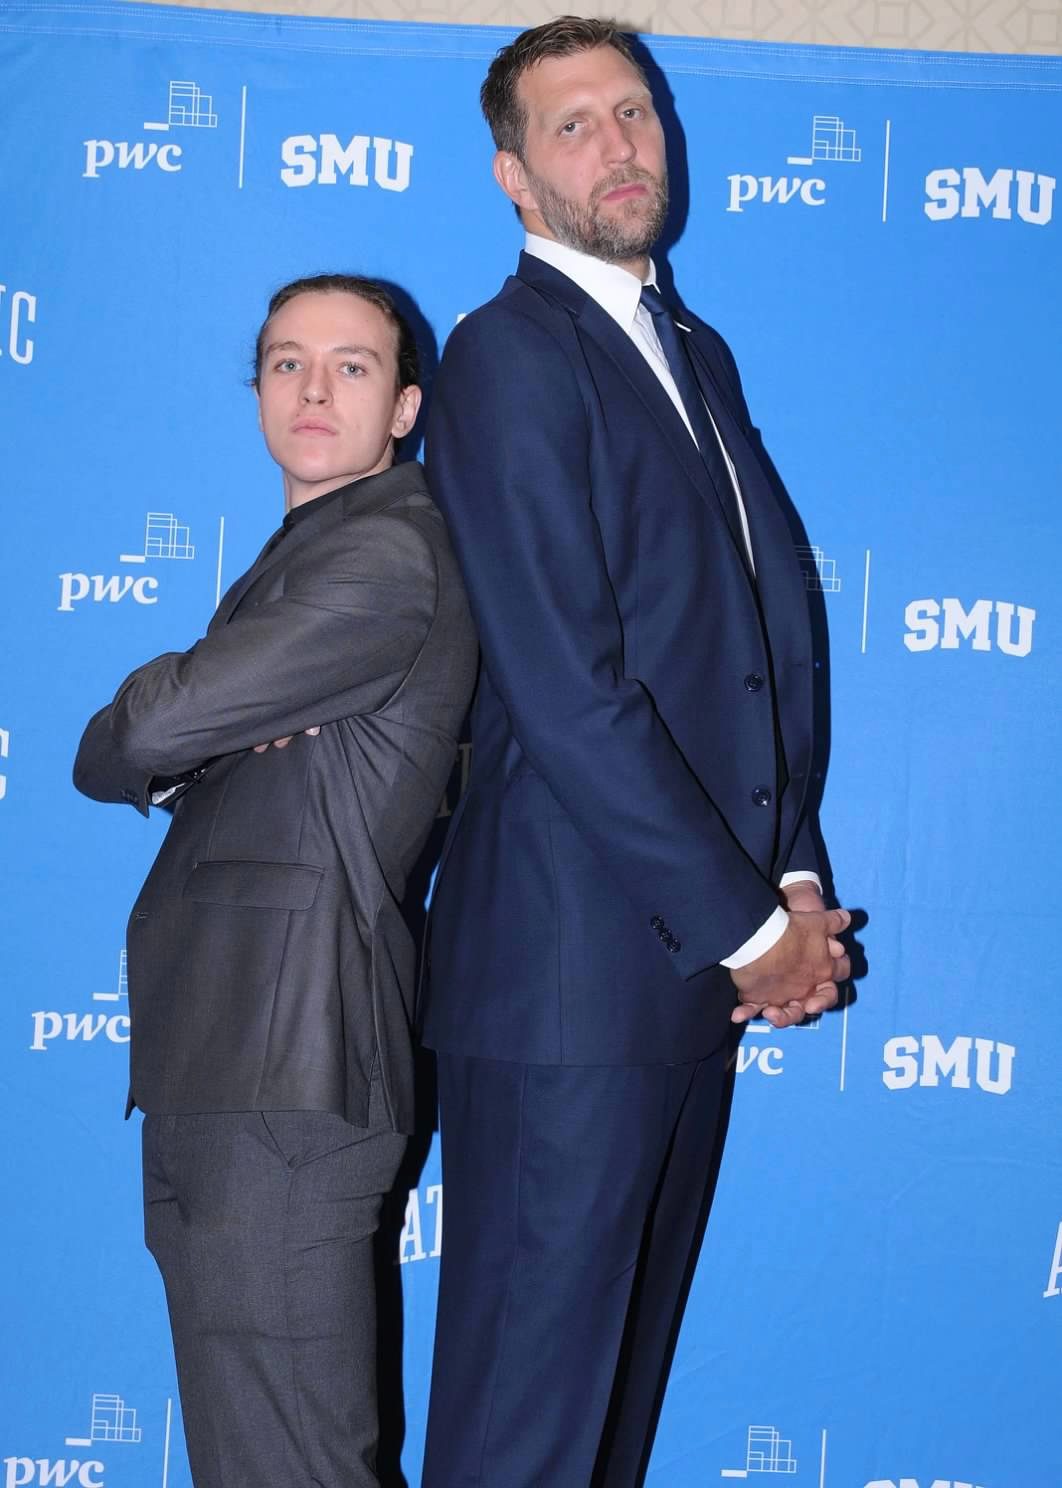
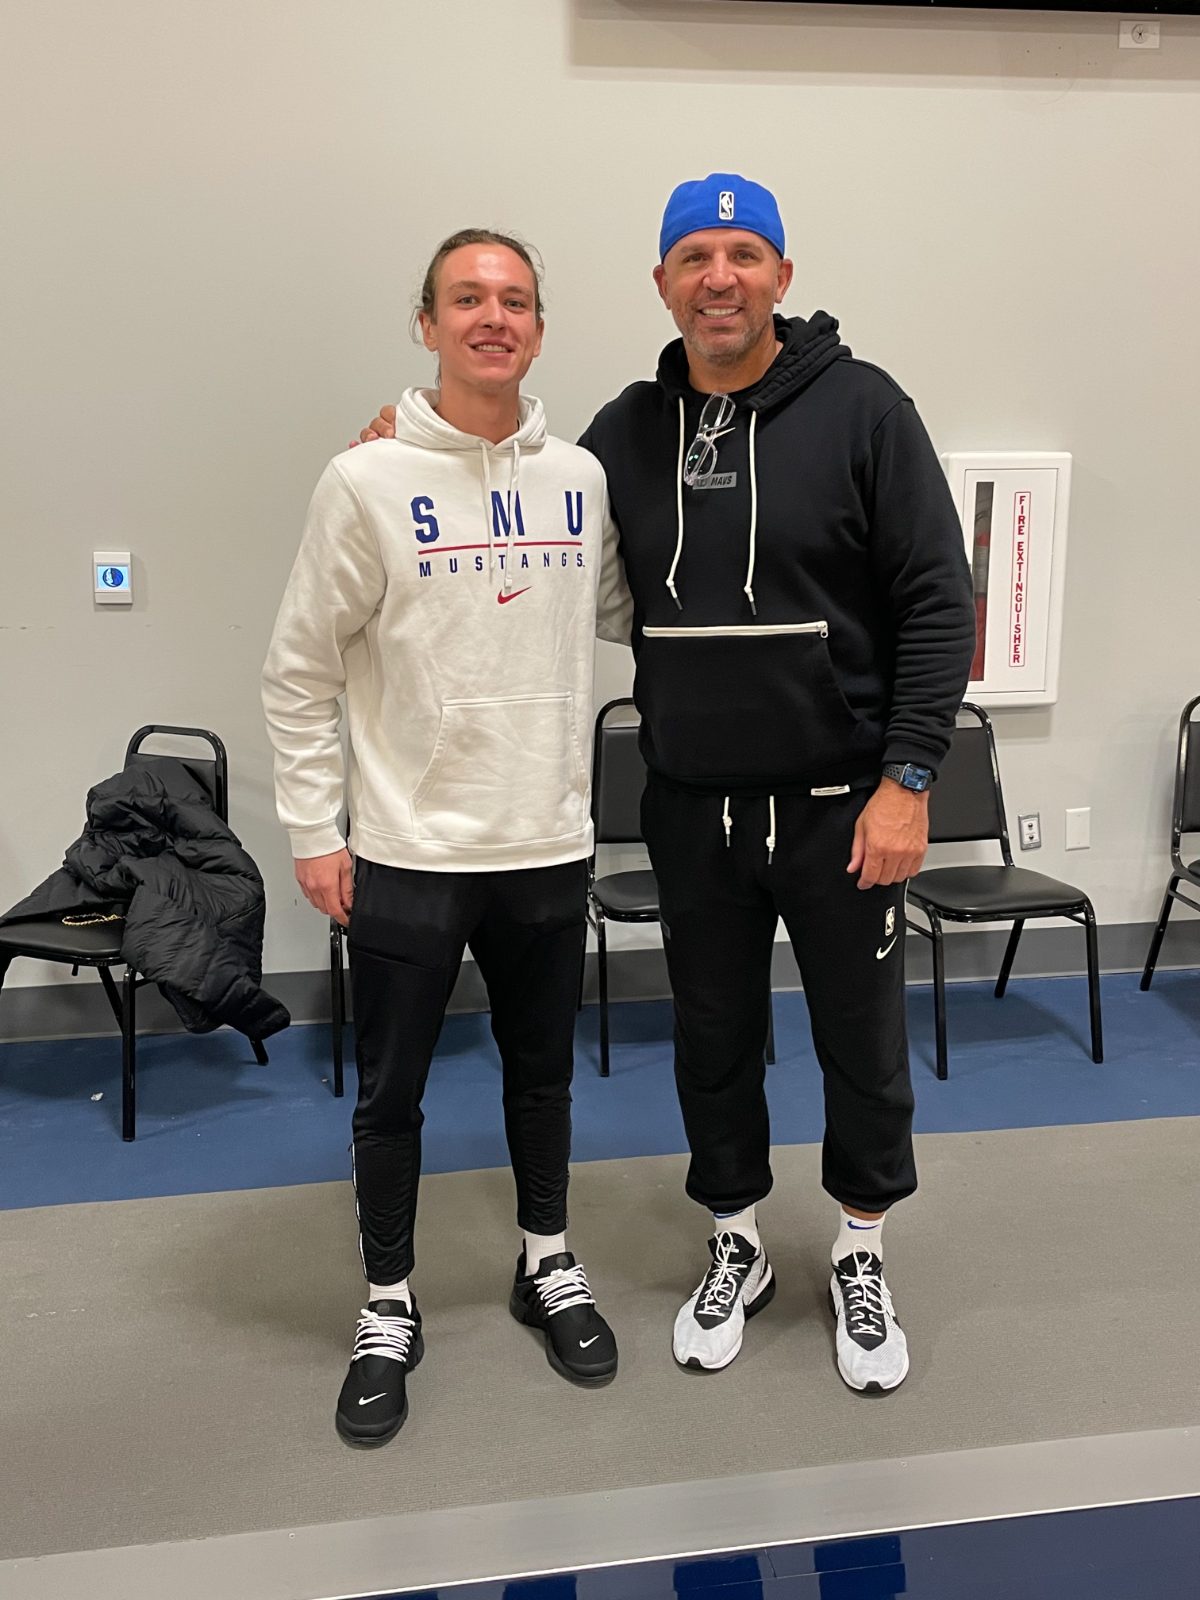
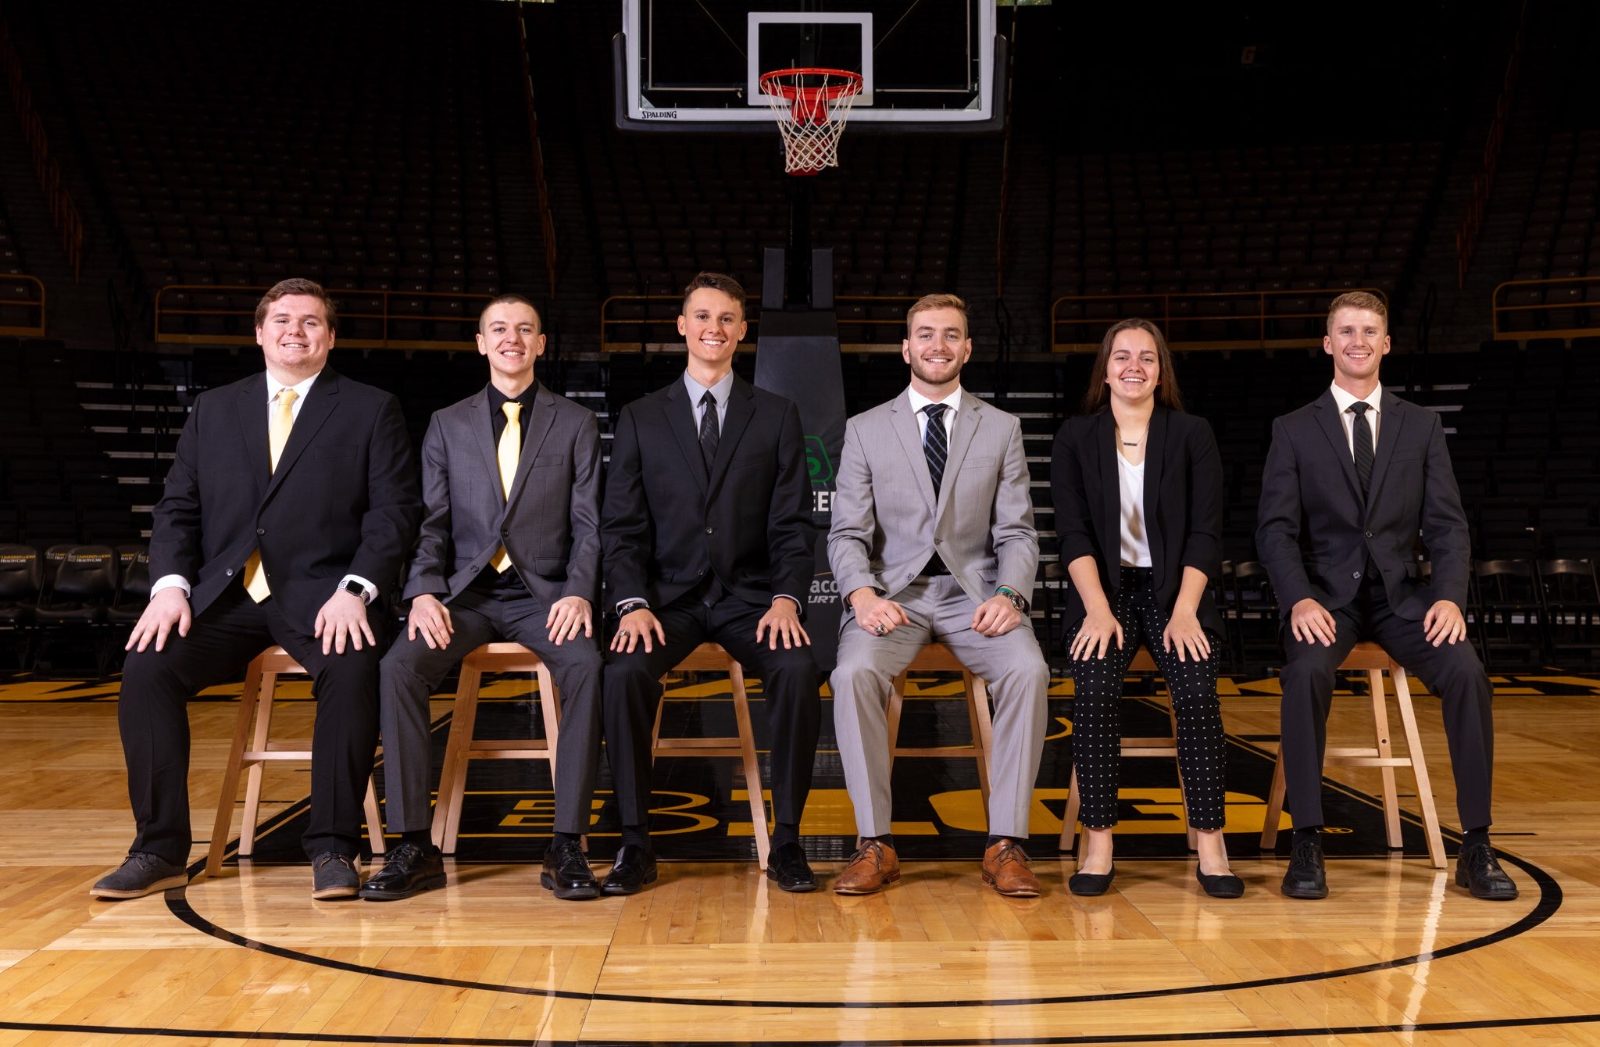
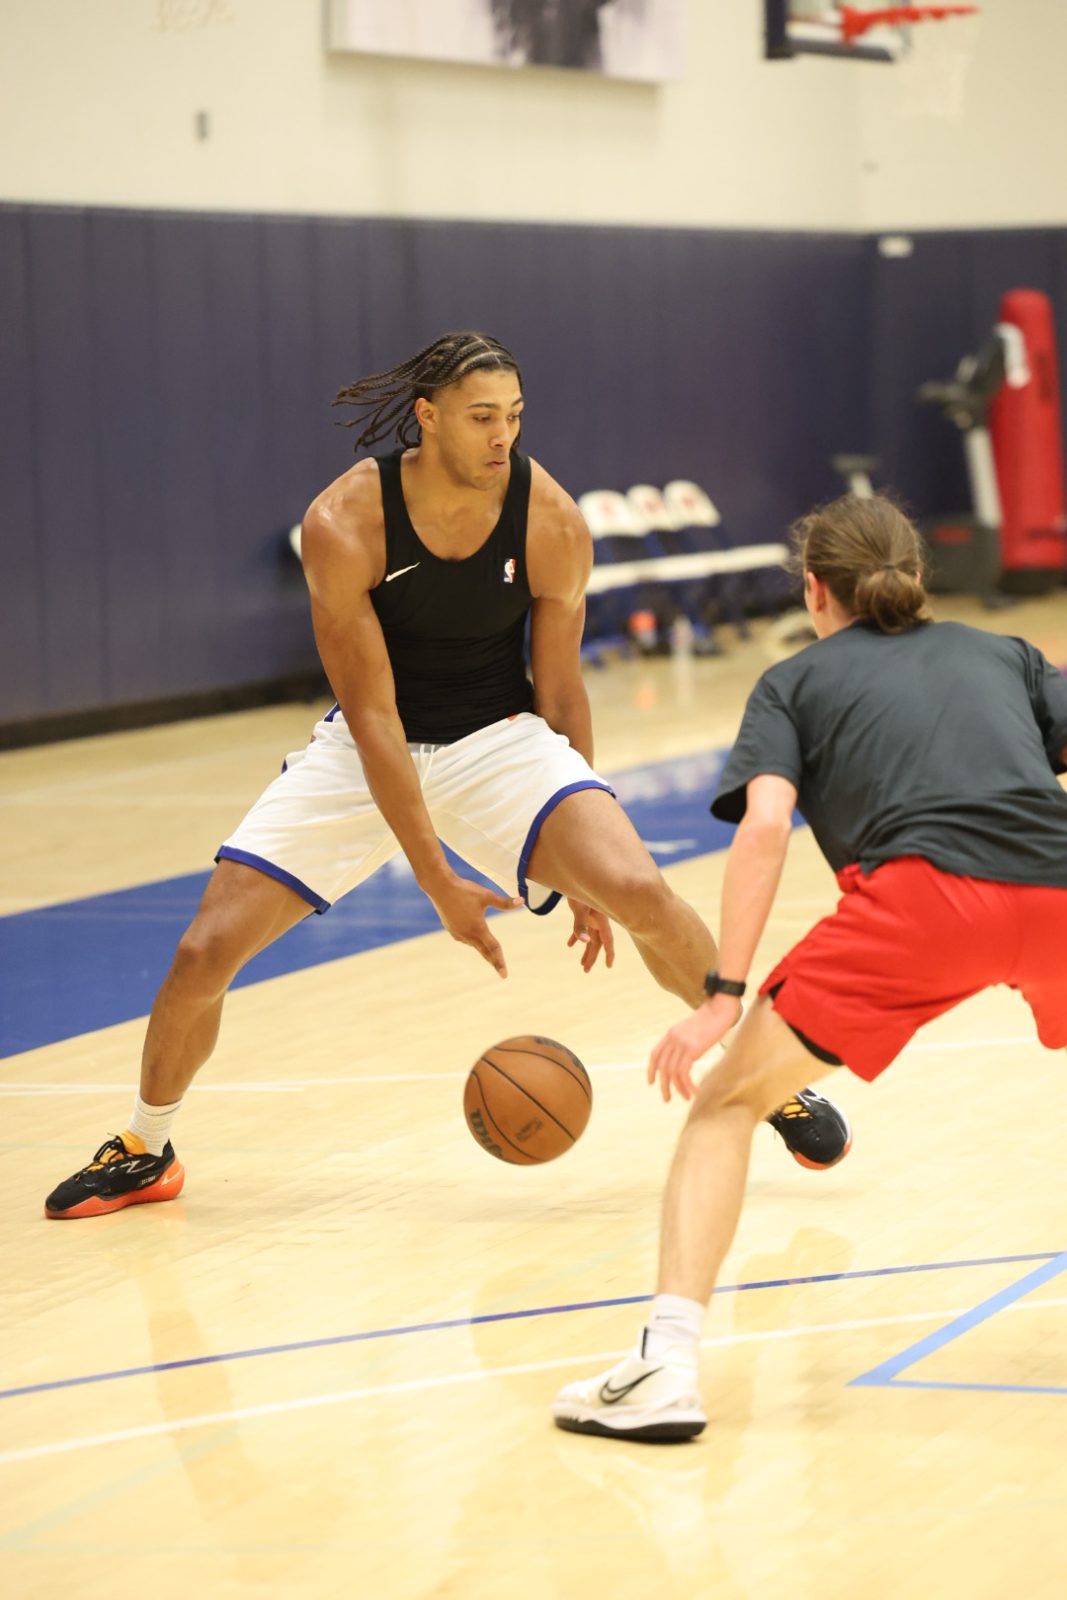
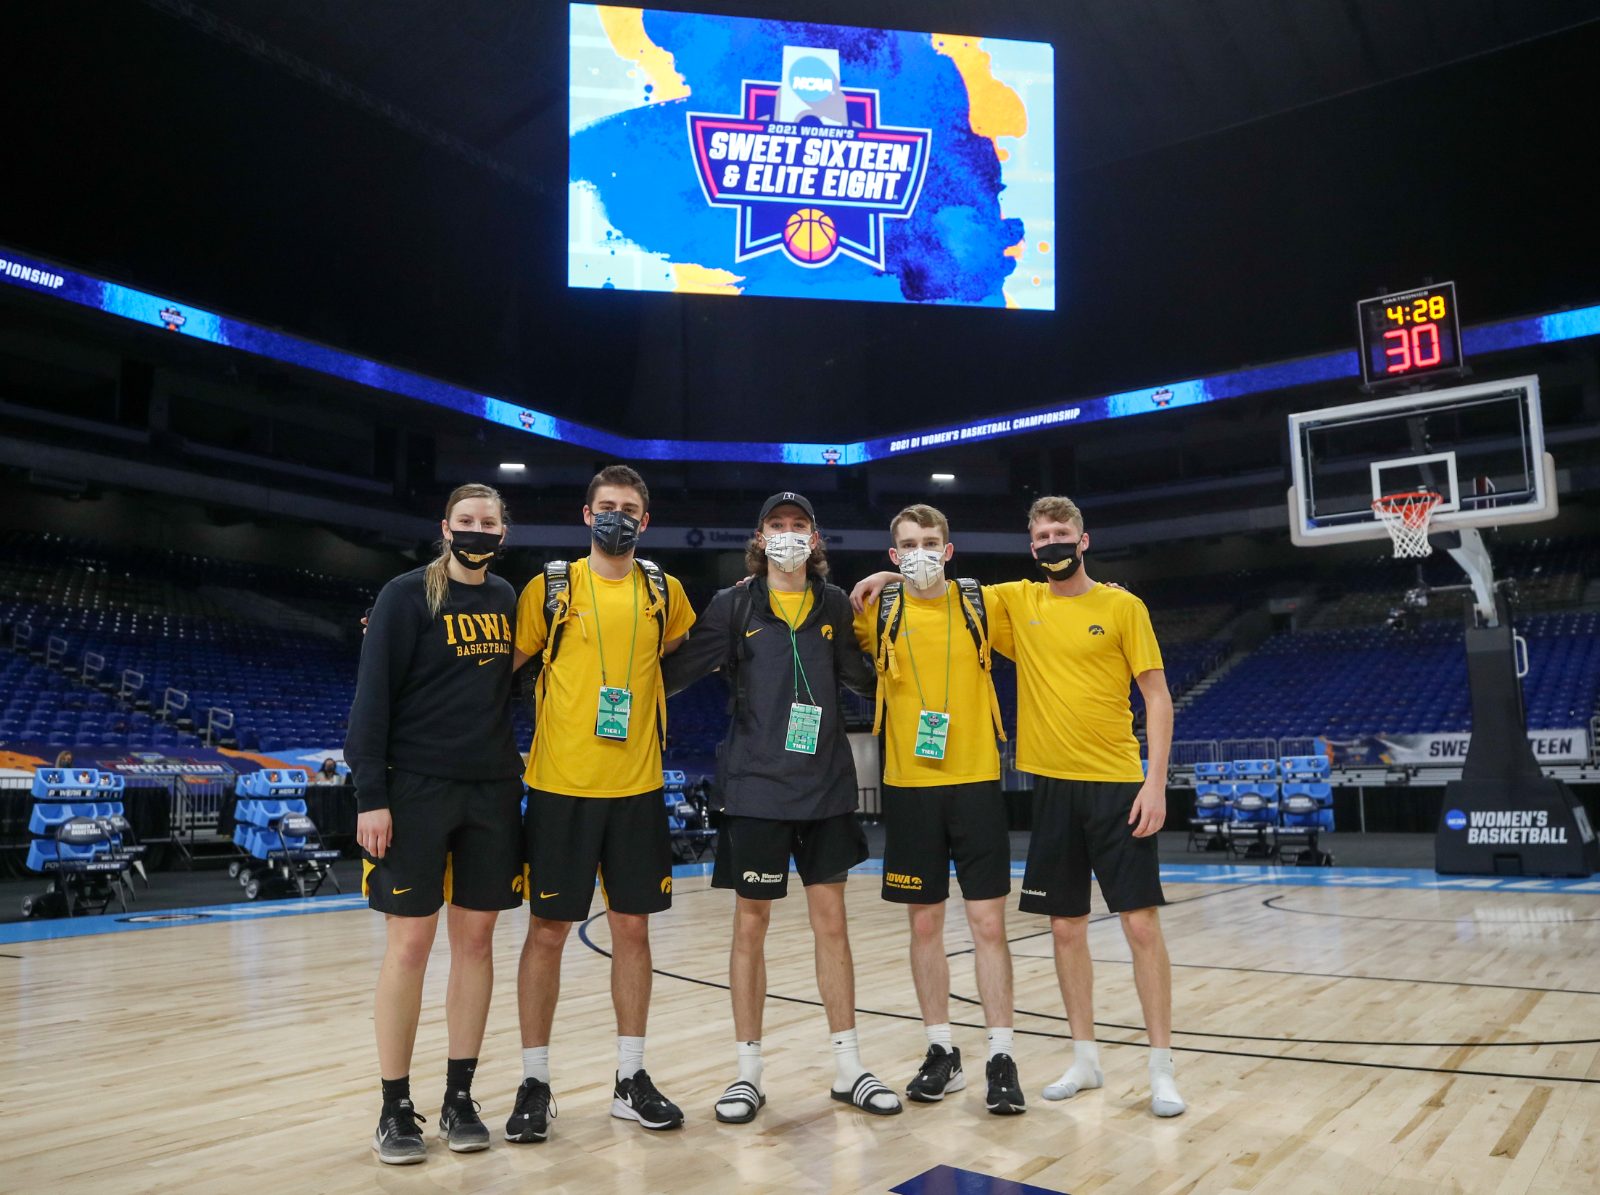
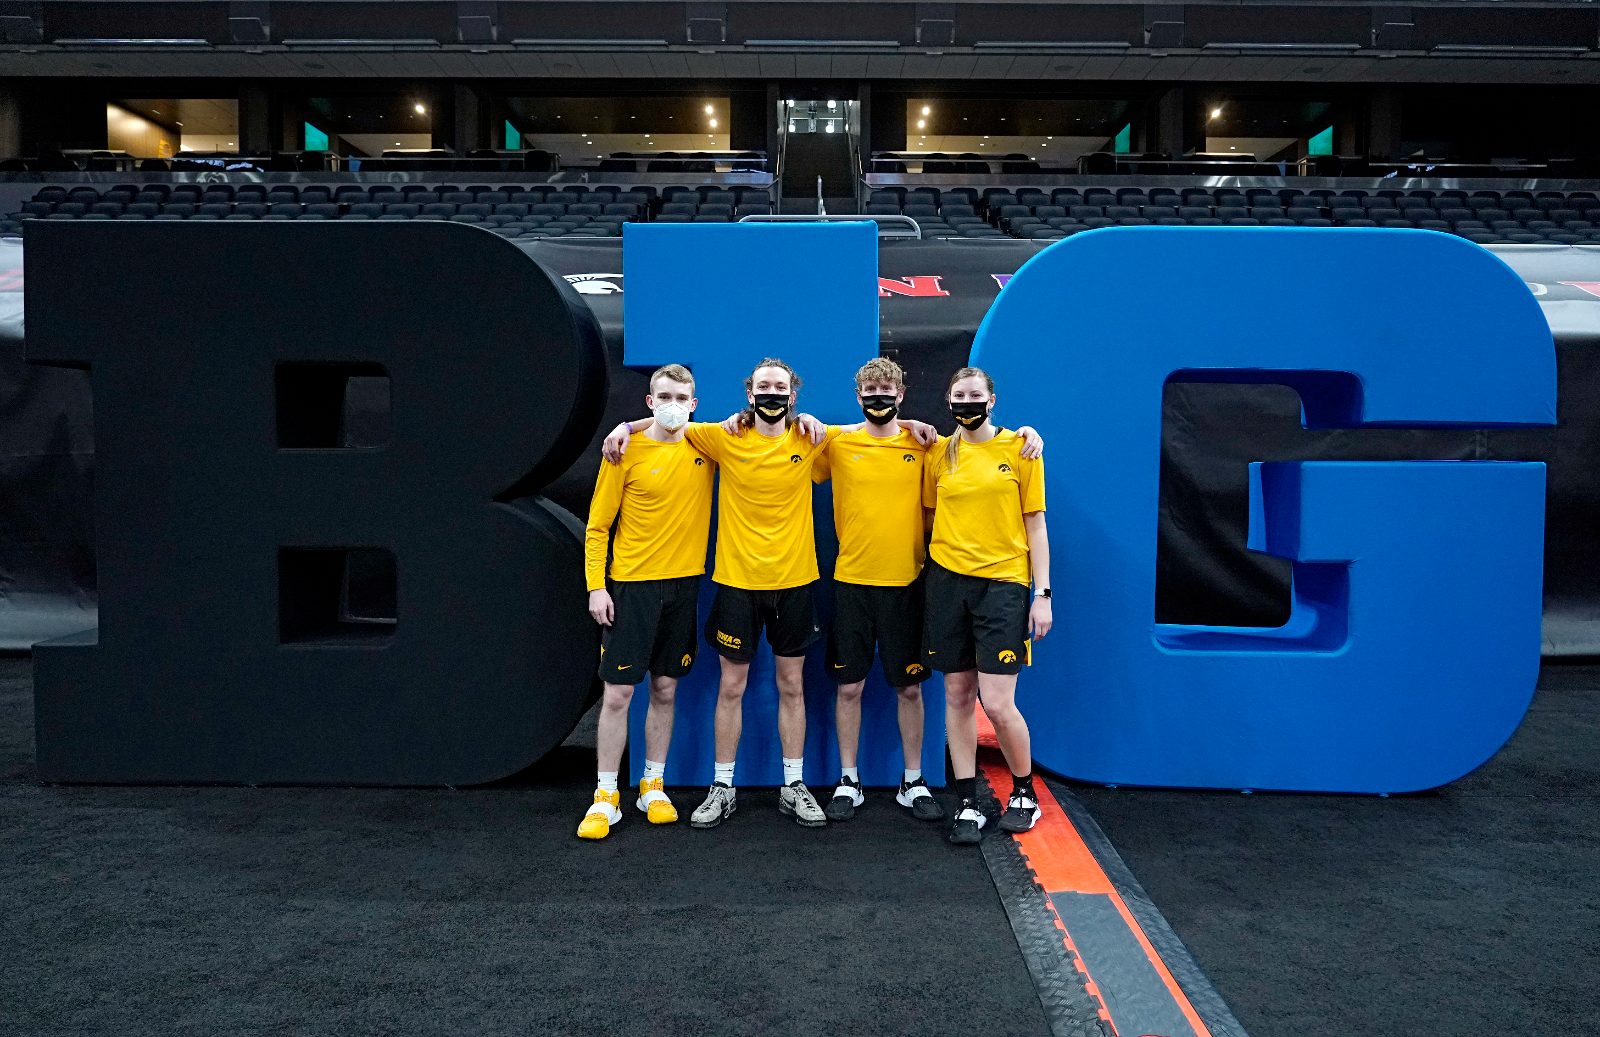
Before analytics was a job title for me, it was basketball. I built practice-stat systems at Iowa and helped the Nigerian National Team read strategy through data as they prepared for the Tokyo Olympics. At SMU I built a recruiting database, helped automate scouting, and worked with NBA players through a professional coaching staff.
Since then it has been collision repair, insurance, and roofing: get the data, model it, and put it where someone can act on it. Sitting at the intersection of humans and technology is where I excel, using technology to bring the best out of people.
I'm at Plan Advisors, where I rebuilt the commissions data process and the database the reporting runs on. Alongside that, I work with Apple Roofing on their data infrastructure and the internal applications sitting on top of it: a Flask app sales and operations use daily, plus the reporting behind it.
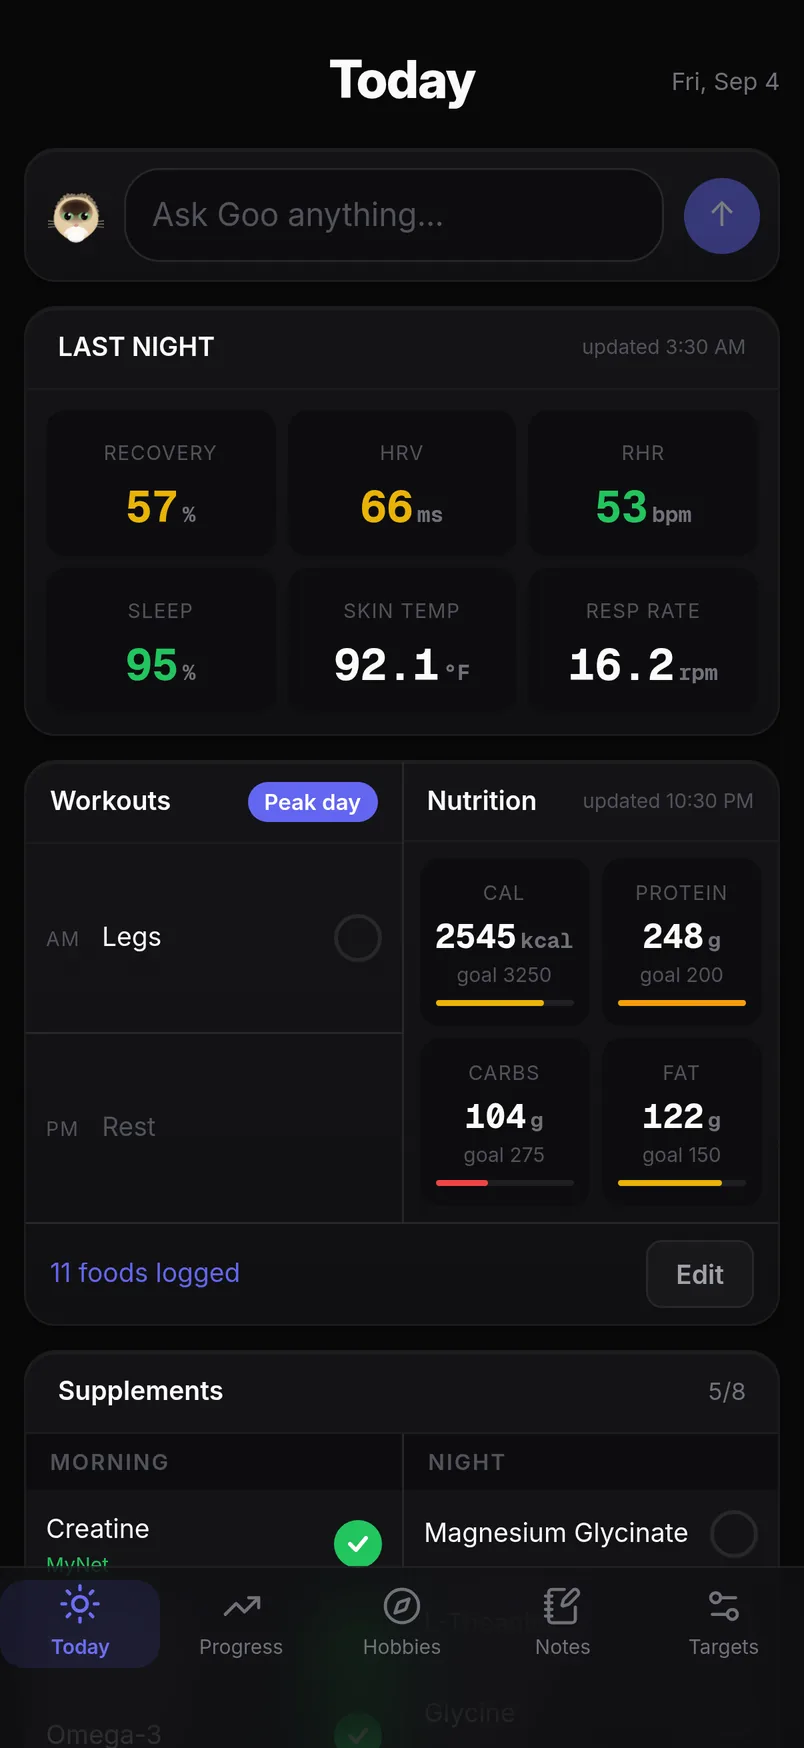
Outside work I build the same way for myself. Life Dashboard is the ongoing one: predictions, flight history, and fantasy sports tracked alongside recovery and training data.
How I work
Education


Skills

- Contracted to build a business intelligence platform on top of the company's Microsoft Fabric data model, developing a Flask application with Claude Code that delivers goal setting, pacing, and prescriptive performance analytics to sales leadership and roofing consultants.
- Designed a goal-setting framework that derives approved, completed, and closed dollar targets from each consultant's historical performance and rolls them up into a holistic, company-wide goal.
- Built pacing analytics that identify who is tracking ahead of or behind goal and quantify the gap, then trace each shortfall back through the pipeline to the stage the consultant needs to work next.
- Developing an agentic layer that converts model output into direct, natural-language guidance, so consultants get exactly what to do next instead of a dashboard to interpret.

- Built and led a team of 4 analysts to redesign and migrate the end-to-end commissions payment process, reducing processing time by approximately 50%.
- Architected and implemented an enterprise-scale commissions data warehouse using Python and DuckDB, transitioning the organization from request-based reporting to proactive, on-demand analytics.
- Designed and operationalized a commissions control framework that passed SOX audit requirements, reducing audit inquiries by 75% and improving response turnaround from ~15 days to within 48 hours.
- Lead financial operations supporting a business unit consistently delivering 70%+ EBITDA margins.

- Built tabular and semantic models for operational and financial reporting, establishing a single source of truth for business performance metrics.
- Leveraged Microsoft Fabric to develop dataflows, semantic models, and reporting pipelines enabling data-driven operational decision-making.
- Automated invoicing for the largest parts vendor using Python and built ETL workflows in RapidMiner delivering fleet account data updates twice daily.
- Engineered a staffing optimization model for Caliber Auto Care that improved labor efficiency and supported positive EBITDA performance.
Four years of basketball staff work before analytics became the day job: practice data, scouting automation, recruiting databases, and a national team's Olympic prep.
- Data engineered a recruiting database providing vital information for coaches to build their recruitment plan.
- Created a system that automatically generates scouting reports from Synergy using R, assisting the Director of Scouting.

- Tracked games from AfroBasket and the Olympic Qualifying Tournament to build a data set on the team ahead of Tokyo.
- Performed exploratory data analysis that confirmed the Head Coach's hypothesis about the effectiveness of their press defense going into the Olympics.
- Revamped practice statistics with an efficient system and visually engaging reports for Iowa's coaching staff.
- Integrated technology on the bench for Coach Bluder, boosting Iowa's journey to National Championship contention.
- Hosted weekly talks on current analytics trends and recruited over 20 members through outreach and academic advisors.
- Taught students R and Python for importing, analyzing, and visualizing professional football, basketball, baseball, and hockey data.